The Art of Multiple Time Frames
Hi Traders
A fairly typical path when you’re new to intraday trading is pulling up a 5 minute or 1 minute chart on your desired instrument as a doorway to a new universe.
But what if that choice, albeit an exciting and guaranteed close up of price action, is really like watching some steroided beast perform the Can Can? And what effect to your mindset if this is your enduring first impression to trading life?

Sadly, THIS was the path I first followed when I was new to trading.
Not only that, when I first started trading I had the ‘other’ unfortunate mishap – I started making easy money! But don’t ask me how I actually pulled it off. I had some very crude little momentum calculator and a bit of luck thrown in. “Nothing to this trading caper,” I thought. “I have it down.”
Well down was something I was just about to learn about. I remember getting a phone call in the middle of the night from a lovely European accented fellow who worked for my Brokerage Company. I remember thinking “what lovely customer care to call Insignificant Me half way across the world to talk about my paltry $10K account.” When actually, what I’ve just described was my first (and thankfully only) ever Margin Call.
There’s no gun involved but it does feel like you’re hostage to some maligned force.Cue actor Alan Rickman playing the evil Hans Gruber character in Die Hard. “Close your position NOW or we’ll do it for YOU.“
As fresh meat to the game, I was ignorant to the release of key monthly economic data that can routinely send price into freefall. Combine that with no stop loss in place and voila, just add water (in my case – tears) and another trading idiot was born.
I made a clear decision then and there to get educated.
I then progressed to making educated mistakes rather uneducated ones – including continuing to park up on the 1 Minute Chart like it was some kingdom unto itself.
Well, a lot of years and experience later, I see all the flawed logic. Yet no one much teaches the conceptual approach to successful intraday trading. The focus is usually on finding a magical lagging indicator you can apply to your chart, or tweaking the setting on your MACD or RSI.
The focus is rarely on understanding why signing off on ONE timeframe as your compass could be restricting your trading growth more than anything else you’re currently doing.
Needing one timeframe to be all things is the Swiss Army Knife approach. Simple efficiency is appealing. But it’s also like saying the ocean is all water so it doesn’t matter where you put the boat in.
My remedial thoughts very much center around a different logic these days. And goes something like this:
The Strength of Longer time frames is that they summarize a lot of information. A simultaneous weakness of those longer timeframes is that they summarize a lot of information. Yes you read right. Sometimes a summary gives you a clearer, crisper look at things. But then in another breath, a summarized view obscures the clues.
Similarly, a strength of the smaller timeframes is that they give you a Close View of everything. A simultaneous weakness is that these smaller time frames give you TOO many clues.
The sifted logic THEN becomes – NO ONE TIMEFRAME GIVES YOU EVERYTHING. Wanting it to be that way is a human tendency (and craving) for Absolutism. If you can build the brain mass to accept a more complex view of it, it actually becomes simpler.
The multi time frame approach therefore involves consulting with higher timeframes for a strategic read of market forces. And consulting with lower/faster timeframes allows you to needle well timed entries in and around those strategic points. This is to suggest that maybe taking your Supports and Resistance points directly and exclusively from a 5 minute or 1 minute chart isn’t necessarily the strongest way to read a chart. For a start, you’ll have too many of them to contend with.
This is where I sift Support and Resistance into a major and minor category. And synthesize my “read” and price navigation by conceptually treating all timeframes as a map of one singular object – just different zoom vantages. It’s a subtle but profound shift in orientation especially if you’re used to being “parked up” on one strict timeframe.
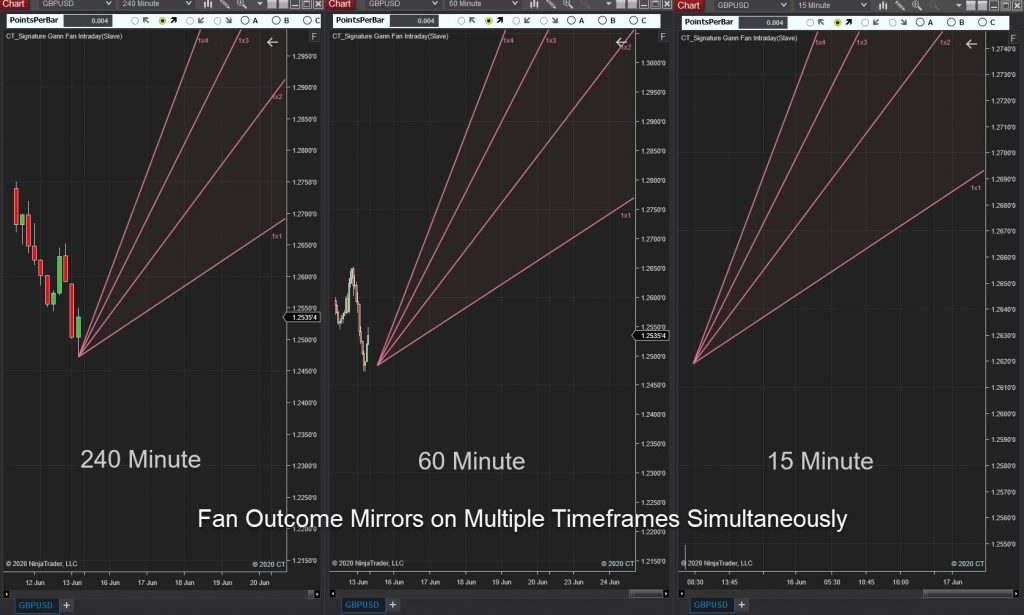
My Signature Intraday Fan Tool (also branded as the Trendline Gradient Template Tool) is very much an extension of these orientations – A tool to help harmonize and synthesize trading clues across multiple intraday timeframes.
As always, I find it ever interesting how the concepts of the market mirror the strata of human emotions. I’m sorry to the Absolutists who might be offended. But life, as is the market, is rarely a polarized black and white outcome of being one thing all of the time. There are layers. And in the layers you find the Sweetspot.
Disclaimer – This post is intended for information and entertainment purposes only. It should not be regarded as financial advice, recommendation, or solicitation of any product, service or trading strategy.